Output Results
Some maps of the electricity transmission network and the energy share of different technologies are plotted.
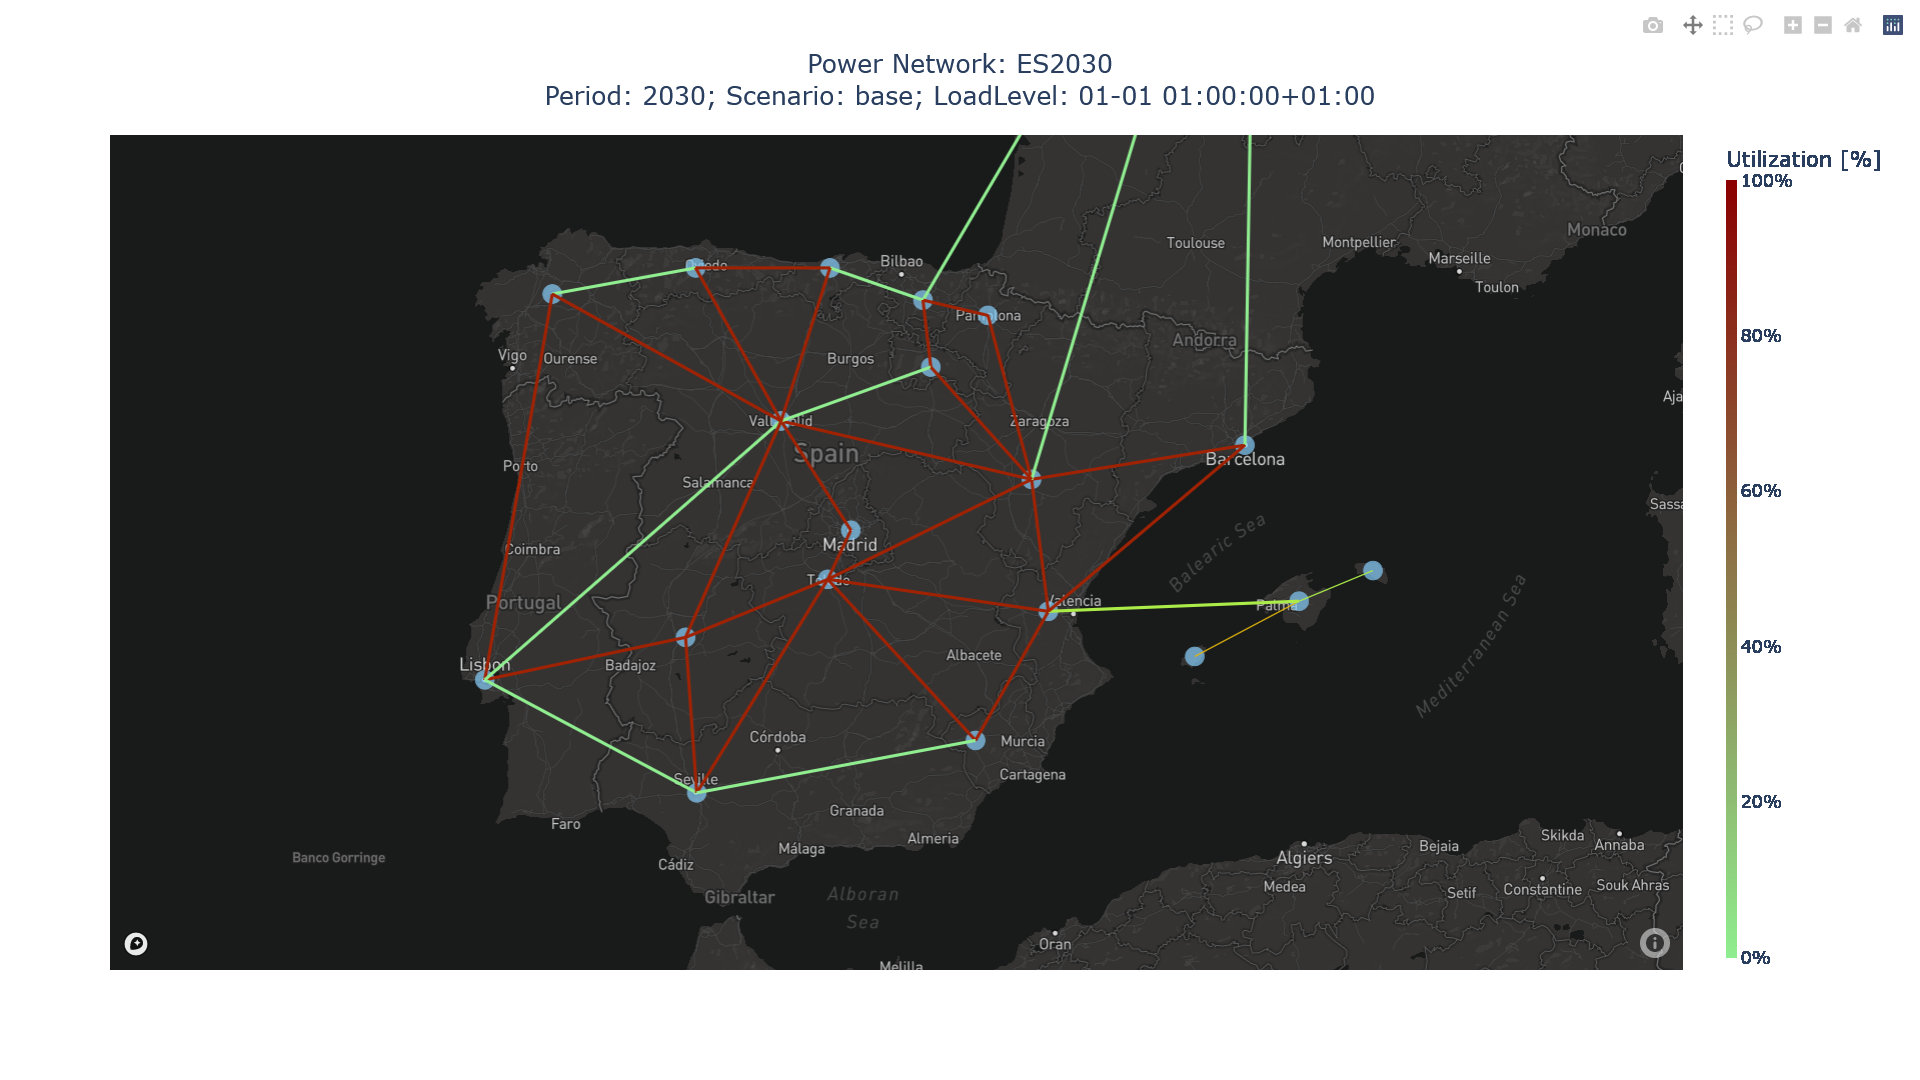
Spain 2030 Electric System (321 generators, 15 nodes, 27 lines), one scenario with hourly resolution
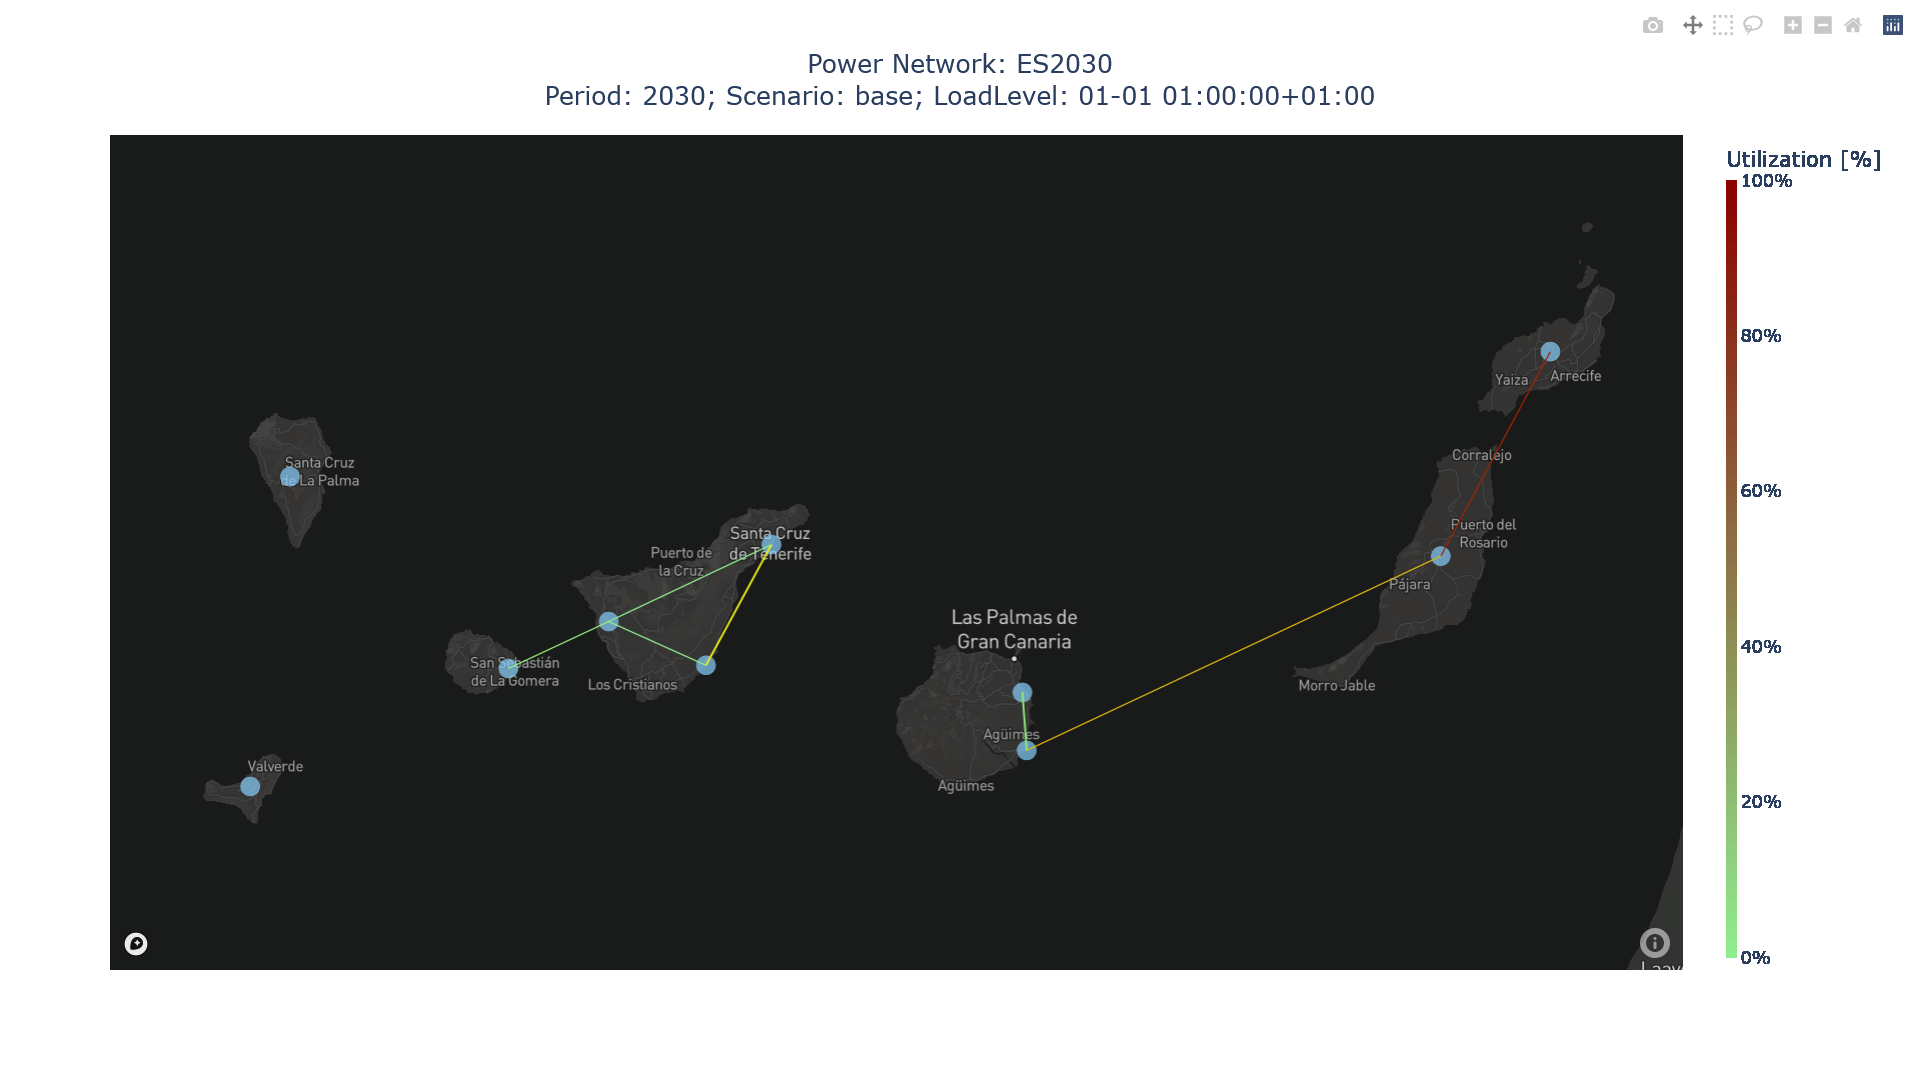
Canary Islands 2030 Electric Systems (94 generators, 7 nodes, 6 lines), one scenario with hourly resolution
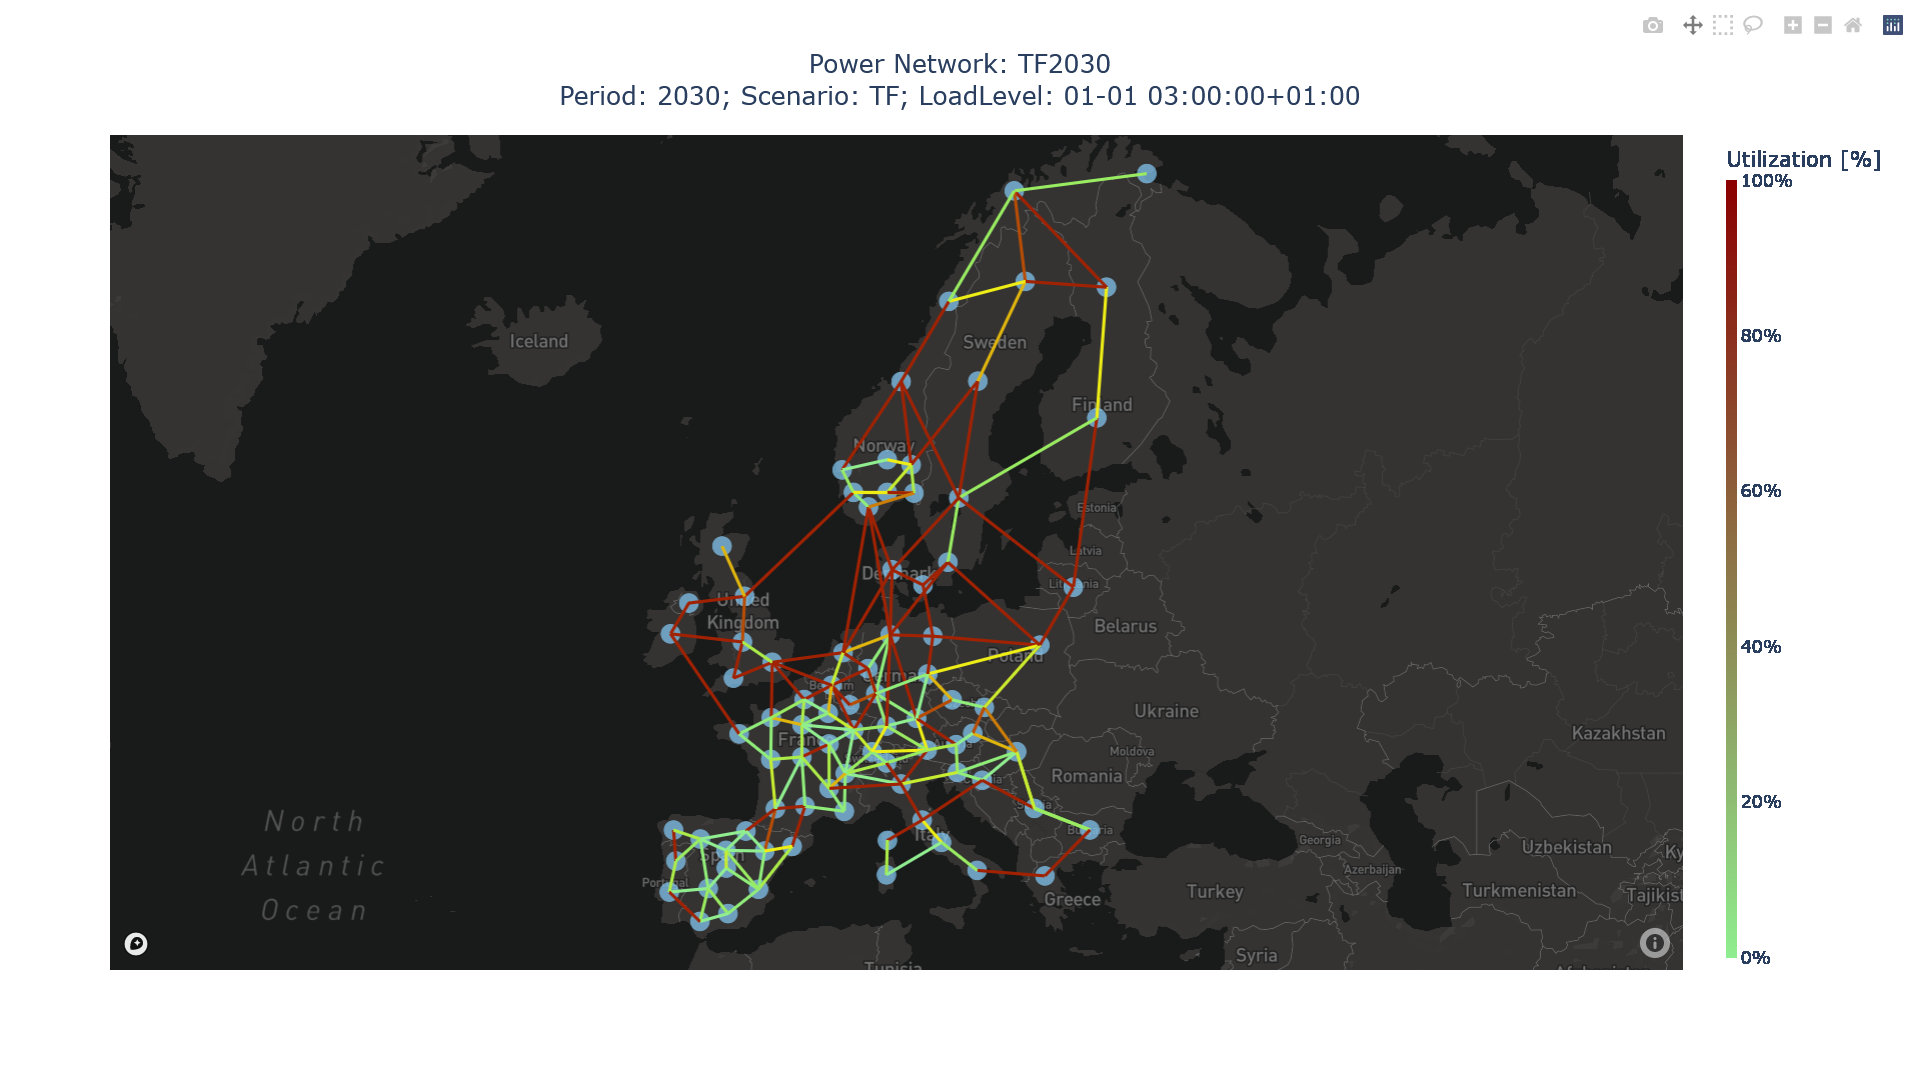
Europe TechnoFriendly 2030 Electric System (1632 generators, 84 nodes, 497 lines), one scenario with hourly resolution
Sweden 2045 Electric and Heat Systems (49 generators, 8 nodes, 6 lines), one scenario with hourly resolution

Technology share for Europe ERAA 2030 Electric System
Technology output for Europe ERAA 2030 Electric System
Nigeria 2030 Electric System (144 generators, 37 nodes, 163 lines), three scenarios with hourly resolution
Kenya 2030-2040-2050 Electric System (127 generators, 47 nodes, 74 lines), one scenario with hourly resolution

Tunisia 2030 Electric System (111 generators, 47 nodes, 88 lines), one scenario with hourly resolution

Uganda 2030 Electric System (118 generators, 49 nodes, 205 lines), one scenario with hourly resolution

The model also generates some additional plots.
The processed result tables can be written as CSV files (the default), a DuckDB database, or both. Pass output_format="csv", "duckdb", or "both" to
openTEPES_run (or to openTEPES_Runner.run). With DuckDB on, the case also writes one oT_Results_<CaseName>.duckdb holding one table per result file. A
"csv" run is byte-identical to earlier versions, so switching format changes only where the results are stored, not their values. One database per case keeps
a parameter sweep single-writer-safe; see Multiple runs.
Separately, the raw parameters, variables, and constraints can be dumped to a DuckDB database for debugging by setting pIndDumpRawResults = 1 in the
openTEPES.py module. This is off by default.
Working with the DuckDB results
With output_format="duckdb" (or "both"), each case writes oT_Results_<CaseName>.duckdb, holding one table per result file. The table name is the result
name without the oT_Result_ prefix and the _<case> suffix — so oT_Result_TechnologyInvestment_9n.csv becomes the table TechnologyInvestment. Query it
with any DuckDB client, and load any result straight into a DataFrame:
import duckdb

con = duckdb.connect("9n/oT_Results_9n.duckdb", read_only=True)
con.execute("SHOW TABLES").df()                          # every result is one table
con.execute("DESCRIBE TechnologyInvestment").df()        # its columns
df = con.execute("SELECT * FROM TechnologyInvestment").df()   # a result as pandas
Across a sweep, aggregate(..., to="duckdb") writes one oT_Sweep.duckdb whose tables (oT_Sweep_<Table>) carry a leading case column, so a whole scan is
one query. case is a SQL keyword, so quote it:
con = duckdb.connect("out/oT_Sweep.duckdb", read_only=True)
con.execute('SELECT * FROM oT_Sweep_TechnologyInvestment WHERE "case" = \'d110\'').df()
The DuckDB and CSV outputs hold the same numbers, so this is purely a convenience for querying and joining results with SQL instead of globbing and concatenating CSVs.
The CSV output files are briefly described in the following sections.
The power is expressed in MW, energy or heat in GWh, marginal costs in €/MWh, and costs in millions of euros (M€). Hydrogen is expressed in tH2. Reservoir volume is expressed in hm3, and water flow in hm3/s. The energy transported in the electricity network is expressed in GWh-Mkm. In each file, the identifiers are described in the first columns, followed by the headers and the description of each variable.
Investment/Retirement
File oT_Result_GenerationInvestment.csv
Identifier |
Header |
Description |
|---|---|---|
Period |
Generator |
Cumulative generation investment power up to this period [MW] |
File oT_Result_GenerationInvestmentPerUnit.csv
Identifier |
Header |
Description |
|---|---|---|
Period |
Generator |
Cumulative generation investment decision up to this period [p.u.] |
File oT_Result_GenerationRetirement.csv
Identifier |
Header |
Description |
|---|---|---|
Period |
Generator |
Cumulative generation retirement power up to this period [MW] |
File oT_Result_GenerationRetirementPerUnit.csv
Identifier |
Header |
Description |
|---|---|---|
Period |
Generator |
Cumulative generation retirement decision up to this period [p.u.] |
File oT_Result_TechnologyInvestment.csv
Identifier |
Header |
Description |
|---|---|---|
Period |
Generator |
Cumulative technology investment power up to this period [MW] |
File oT_Result_TechnologyInvestment_AreaName.csv
Identifier |
Header |
Description |
|---|---|---|
Period |
Generator |
Cumulative technology investment power per area up to this period [MW] |
File oT_Result_TechnologyInvestmentCost.csv
Identifier |
Header |
Description |
|---|---|---|
Period |
Generator |
Technology investment cost [M€] |
File oT_Result_TechnologyInvestmentCostPerMW.csv
Identifier |
Header |
Description |
|---|---|---|
Period |
Generator |
Technology investment cost per MW [M€/MW] |
File oT_Result_TechnologyRetirement.csv
Identifier |
Header |
Description |
|---|---|---|
Period |
Generator |
Technology retirement power [MW] |
File oT_Result_NetworkInvestmentPerUnit.csv
Identifier |
Header |
Description |
||
|---|---|---|---|---|
Period |
Initial node |
Final node |
Circuit |
Cumulative electricity network investment decision up to this period [p.u.] |
File oT_Result_NetworkInvestmentMWkm.csv
Identifier |
Header |
Description |
||
|---|---|---|---|---|
Period |
Initial node |
Final node |
Circuit |
Cumulative electricity network investment up to this period [MWkm] |
File oT_Result_ReserveMargin.csv
Identifier |
Header |
Description |
|
|---|---|---|---|
Period |
Scenario |
GW |
Reserve margin |
File oT_Result_ReserveMarginPerUnit.csv
Identifier |
Header |
Description |
|
|---|---|---|---|
Period |
Scenario |
p.u. |
Per unit reserve margin |
File oT_Result_LargestUnitPerUnit.csv
Identifier |
Header |
Description |
|
|---|---|---|---|
Period |
Scenario |
p.u. |
Per unit largest unit |
Electricity generation operation
File oT_Result_GenerationCommitment.csv
Identifier |
Header |
Description |
||
|---|---|---|---|---|
Period |
Scenario |
Load level |
Generator |
Commitment decision [p.u.] |
File oT_Result_GenerationStartUp.csv
Identifier |
Header |
Description |
||
|---|---|---|---|---|
Period |
Scenario |
Load level |
Generator |
Startup decision [p.u.] |
File oT_Result_GenerationShutDown.csv
Identifier |
Header |
Description |
||
|---|---|---|---|---|
Period |
Scenario |
Load level |
Generator |
Shutdown decision [p.u.] |
File oT_Result_GenerationOperatingReserveUp.csv
Identifier |
Header |
Description |
||
|---|---|---|---|---|
Period |
Scenario |
Load level |
Generator |
Upward operating reserve of each generator [MW] |
File oT_Result_GenerationOperatingReserveDown.csv
Identifier |
Header |
Description |
||
|---|---|---|---|---|
Period |
Scenario |
Load level |
Generator |
Downward operating reserve of each generator [MW] |
File oT_Result_GenerationOperatingReserveUpEnergy.csv
Identifier |
Header |
Description |
||
|---|---|---|---|---|
Period |
Scenario |
Load level |
Generator |
Upward operating reserve energy of each generator [MW] |
File oT_Result_GenerationOperatingReserveDownEnergy.csv
Identifier |
Header |
Description |
||
|---|---|---|---|---|
Period |
Scenario |
Load level |
Generator |
Downward operating reserve energy of each generator [MW] |
File oT_Result_GenerationRampReserveUp.csv
Identifier |
Header |
Description |
||
|---|---|---|---|---|
Period |
Scenario |
Load level |
Generator |
Ramp up reserve of each generator [MW] |
File oT_Result_GenerationRampReserveDown.csv
Identifier |
Header |
Description |
||
|---|---|---|---|---|
Period |
Scenario |
Load level |
Generator |
Ramp down reserve of each generator [MW] |
File oT_Result_Generation.csv
Identifier |
Header |
Description |
||
|---|---|---|---|---|
Period |
Scenario |
Load level |
Generator |
Output (discharge in ESS) [MW] |
File oT_Result_NetDemand.csv
VRES are variable renewable energy sources (e.g., wind and solar), units with null linear variable cost and no storage capacity. The net demand is the demand minus the VRES.
Identifier |
Description |
||
|---|---|---|---|
Period |
Scenario |
Load level |
Net demand (demand - VRES) [MW] |
File oT_Result_NetDemandNetwork.csv
Identifier |
Header |
Description |
||
|---|---|---|---|---|
Period |
Scenario |
Load level |
Node |
Electricity net demand (demand - VRES) [MW] |
File oT_Result_GenerationSurplus.csv
The surplus power is the additional generation available from a generator up to its maximum power.
Identifier |
Header |
Description |
||
|---|---|---|---|---|
Period |
Scenario |
Load level |
Generator |
Power surplus [MW] |
File oT_Result_GenerationRampUpSurplus.csv
The upward ramp surplus is the additional upward ramp capacity available from a generator until it reaches its maximum upward ramp capacity.
Identifier |
Header |
Description |
||
|---|---|---|---|---|
Period |
Scenario |
Load level |
Generator |
Upward ramp surplus [MW] |
File oT_Result_GenerationRampDownSurplus.csv
The downward ramp surplus is the additional downward ramp capacity available from a generator until it reaches its maximum downward ramp capacity.
Identifier |
Header |
Description |
||
|---|---|---|---|---|
Period |
Scenario |
Load level |
Generator |
Downward ramp surplus [MW] |
File oT_Result_GenerationCurtailment.csv
The curtailed power is the power from variable renewable energy sources (VRES) that is not used to satisfy the electricity demand.
Identifier |
Header |
Description |
||
|---|---|---|---|---|
Period |
Scenario |
Load level |
VRES Generator |
Curtailed power of VRES [MW] |
File oT_Result_GenerationCurtailmentEnergy.csv
Identifier |
Header |
Description |
||
|---|---|---|---|---|
Period |
Scenario |
Load level |
VRES Generator |
Curtailed energy of VRES [GWh] |
File oT_Result_GenerationCurtailmentEnergyRelative.csv
Identifier |
Header |
Description |
||
|---|---|---|---|---|
Period |
Scenario |
Load level |
VRES Generator |
Percentage of energy curtailed of VRES [%] |
File oT_Result_GenerationEnergy.csv
Identifier |
Header |
Description |
||
|---|---|---|---|---|
Period |
Scenario |
Load level |
Generator |
Energy (discharge in ESS) [GWh] |
File oT_Result_GenerationEmission.csv
Identifier |
Header |
Description |
||
|---|---|---|---|---|
Period |
Scenario |
Load level |
Generator |
CO2 emission [MtCO2] |
File oT_Result_GenerationIncrementalEmission.csv
Identifier |
Header |
Description |
|||
|---|---|---|---|---|---|
Period |
Scenario |
Load level |
Area |
Generator |
Emission rate of the generators with power surplus, except the ESS [tCO2/MWh] |
File oT_Result_TechnologyGeneration.csv
Identifier |
Header |
Description |
||
|---|---|---|---|---|
Period |
Scenario |
Load level |
Technology |
Output (discharge in ESS) [MW] |
File oT_Result_TechnologyGenerationEnergy.csv
Identifier |
Header |
Description |
||
|---|---|---|---|---|
Period |
Scenario |
Load level |
Technology |
Energy (discharge in ESS) [GWh] |
File oT_Result_TechnologyGenerationEnergy_AreaName.csv
Identifier |
Header |
Description |
||
|---|---|---|---|---|
Period |
Scenario |
Load level |
Technology |
Energy (discharge in ESS) per area [GWh] |
File oT_Result_TechnologyCurtailmentEnergy.csv
Identifier |
Header |
Description |
||
|---|---|---|---|---|
Period |
Scenario |
Load level |
Technology |
Curtailed energy of VRES [GWh] |
File oT_Result_TechnologyCurtailmentEnergyRelative.csv
Identifier |
Header |
Description |
||
|---|---|---|---|---|
Period |
Scenario |
Load level |
Technology |
Percentage of energy curtailed of VRES [%] |
File oT_Result_TechnologyEmission.csv
Identifier |
Header |
Description |
||
|---|---|---|---|---|
Period |
Scenario |
Load level |
Technology |
CO2 emission [MtCO2] |
File oT_Result_TechnologyEmission_AreaName.csv
Identifier |
Header |
Description |
||
|---|---|---|---|---|
Period |
Scenario |
Load level |
Technology |
CO2 emission per area [MtCO2] |
File oT_Result_TechnologyGenOperatingReserveUp.csv
Identifier |
Header |
Description |
||
|---|---|---|---|---|
Period |
Scenario |
Load level |
Technology |
Upward operating reserve [MW] |
File oT_Result_TechnologyGenOperatingReserveDown.csv
Identifier |
Header |
Description |
||
|---|---|---|---|---|
Period |
Scenario |
Load level |
Technology |
Downward operating reserve [MW] |
File oT_Result_TechnologyGenOperatingReserveUpEnergy.csv
Identifier |
Header |
Description |
||
|---|---|---|---|---|
Period |
Scenario |
Load level |
Technology |
Upward operating reserve energy [MW] |
File oT_Result_TechnologyGenOperatingReserveDownEnergy.csv
Identifier |
Header |
Description |
||
|---|---|---|---|---|
Period |
Scenario |
Load level |
Technology |
Downward operating reserve energy [MW] |
File oT_Result_TechnologySpillage.csv
Energy spillage refers to the energy that cannot be stored in the ESS due to its storage capacity limitations.
Identifier |
Header |
Description |
||
|---|---|---|---|---|
Period |
Scenario |
Load level |
Technology |
Spilled energy [GWh] |
File oT_Result_TechnologySpillageRelative.csv
Identifier |
Header |
Description |
||
|---|---|---|---|---|
Period |
Scenario |
Load level |
Technology |
Spilled energy in ESS w.r.t. the energy inflows [%] |
File oT_Result_MarketResultsDemand.csv
Identifier |
Header |
Description |
||||
|---|---|---|---|---|---|---|
Period |
Scenario |
Load level |
Area |
Node |
Demand |
Demand cleared [MW] (including demand, consumption, and losses) |
… |
… |
… |
… |
… |
SRMC |
Locational Short-Run Marginal Cost [€/MWh] |
File oT_Result_MarketResultsTechnologyInvestment.csv
Identifier |
Header |
Description |
|
|---|---|---|---|
Period |
Technology |
Power |
Cumulative power investment on each technology up to this period [MW] |
… |
… |
Cost |
Investment cost [M€] |
… |
… |
Energy |
Energy produced [GWh] |
… |
… |
LCOE |
Levelized Cost of Electricity [€/MWh] |
File oT_Result_MarketResultsGenerationInvestment.csv
Identifier |
Header |
Description |
|
|---|---|---|---|
Period |
Generator |
Power |
Cumulative power investment on each generator up to this period [MW] |
File oT_Result_MarketResultsGeneration.csv
Identifier |
Header |
Description |
|||||
|---|---|---|---|---|---|---|---|
Period |
Scenario |
Load level |
Area |
Node |
Generator |
Generation |
Power output of each generator [MWh] |
… |
… |
… |
… |
… |
… |
Curtailment |
Curtailment of each generator [MWh] |
… |
… |
… |
… |
… |
… |
Emissions |
Emissions of each generator [MtCO2] |
ESS operation
File oT_Result_Consumption.csv
Identifier |
Header |
Description |
||
|---|---|---|---|---|
Period |
Scenario |
Load level |
Generator |
Consumed/charged power for each ESS [MW] |
File oT_Result_ConsumptionEnergy.csv
Identifier |
Header |
Description |
||
|---|---|---|---|---|
Period |
Scenario |
Load level |
Generator |
Consumed/charged energy for each ESS [GWh] |
File oT_Result_ConsumptionOperatingReserveUp.csv
Identifier |
Header |
Description |
||
|---|---|---|---|---|
Period |
Scenario |
Load level |
Generator |
Upward operating reserve of each pump/charge [MW] |
File oT_Result_ConsumptionOperatingReserveDown.csv
Identifier |
Header |
Description |
||
|---|---|---|---|---|
Period |
Scenario |
Load level |
Generator |
Downward operating reserve of each pump/charge [MW] |
File oT_Result_ConsumptionOperatingReserveUpEnergy.csv
Identifier |
Header |
Description |
||
|---|---|---|---|---|
Period |
Scenario |
Load level |
Generator |
Upward operating reserve energy of each pump/charge [MW] |
File oT_Result_ConsumptionOperatingReserveDownEnergy.csv
Identifier |
Header |
Description |
||
|---|---|---|---|---|
Period |
Scenario |
Load level |
Generator |
Downward operating reserve energy of each pump/charge [MW] |
File oT_Result_GenerationConsumptionRatio.csv
Identifier |
Header |
Description |
||
|---|---|---|---|---|
Period |
Scenario |
Load level |
Generator |
Generation to consumption ratio for each ESS [p.u.] (1 only generating, -1 only consuming, 0 no generating or consuming, ratio when generating and consuming) |
File oT_Result_GenerationOutflows.csv
Identifier |
Header |
Description |
||
|---|---|---|---|---|
Period |
Scenario |
Load level |
Generator |
Outflows power for each ESS [MW] |
File oT_Result_GenerationOutflowsEnergy.csv
Identifier |
Header |
Description |
||
|---|---|---|---|---|
Period |
Scenario |
Load level |
Generator |
Outflows energy for each ESS [GWh] |
File oT_Result_TechnologyConsumption.csv
Identifier |
Header |
Description |
||
|---|---|---|---|---|
Period |
Scenario |
Load level |
Technology |
Consumption (charge in ESS) [MW] |
File oT_Result_TechnologyConsumptionEnergy.csv
Identifier |
Header |
Description |
||
|---|---|---|---|---|
Period |
Scenario |
Load level |
Technology |
Energy (charge in ESS) [GWh] |
File oT_Result_TechnologyConsumptionEnergy_AreaName.csv
Identifier |
Header |
Description |
||
|---|---|---|---|---|
Period |
Scenario |
Load level |
Technology |
Energy (charge in ESS) per area [GWh] |
File oT_Result_TechnologyOutflows.csv
Identifier |
Header |
Description |
||
|---|---|---|---|---|
Period |
Scenario |
Load level |
Technology |
Outflows power for each ESS [MW] |
File oT_Result_TechnologyOutflowsEnergy.csv
Identifier |
Header |
Description |
||
|---|---|---|---|---|
Period |
Scenario |
Load level |
Technology |
Energy (Outflows in ESS) [GWh] |
File oT_Result_TechnologyConOperatingReserveUp.csv
Identifier |
Header |
Description |
||
|---|---|---|---|---|
Period |
Scenario |
Load level |
Technology |
Upward operating reserve of each pump/charge [MW] |
File oT_Result_TechnologyConOperatingReserveDown.csv
Identifier |
Header |
Description |
||
|---|---|---|---|---|
Period |
Scenario |
Load level |
Technology |
Downward operating reserve of each pump/charge [MW] |
File oT_Result_TechnologyConOperatingReserveUpEnergy.csv
Identifier |
Header |
Description |
||
|---|---|---|---|---|
Period |
Scenario |
Load level |
Technology |
Upward operating reserve energy of each pump/charge [MW] |
File oT_Result_TechnologyConOperatingReserveDownEnergy.csv
Identifier |
Header |
Description |
||
|---|---|---|---|---|
Period |
Scenario |
Load level |
Technology |
Downward operating reserve energy of each pump/charge [MW] |
File oT_Result_GenerationInventory.csv
Identifier |
Header |
Description |
||
|---|---|---|---|---|
Period |
Scenario |
Load level |
Generator |
Stored energy (SoC in batteries, reservoir energy in pumped-hydro storage power plants) [GWh] |
File oT_Result_GenerationInventoryUtilization.csv
Identifier |
Header |
Description |
||
|---|---|---|---|---|
Period |
Scenario |
Load level |
Generator |
Utilization factor of the storage (SoC in batteries, reservoir energy in pumped-hydro storage power plants) [p.u.] |
File oT_Result_GenerationSpillage.csv
Identifier |
Header |
Description |
||
|---|---|---|---|---|
Period |
Scenario |
Load level |
Generator |
Spilled energy for each ESS [GWh] |
File oT_Result_GenerationSpillageRelative.csv
Identifier |
Header |
Description |
||
|---|---|---|---|---|
Period |
Scenario |
Load level |
Generator |
Spilled energy for each ESS w.r.t. the energy inflows [%] |
File oT_Result_SummaryGeneration.csv
Identifier |
Header |
Description |
||
|---|---|---|---|---|
Period |
Scenario |
Load level |
Generator |
Generation output (to be used as a pivot table) |
Reservoir operation
File oT_Result_ReservoirVolume.csv
Identifier |
Header |
Description |
||
|---|---|---|---|---|
Period |
Scenario |
Load level |
Reservoir |
Reservoir volume [hm3] |
File oT_Result_ReservoirVolumeUtilization.csv
Identifier |
Header |
Description |
||
|---|---|---|---|---|
Period |
Scenario |
Load level |
Reservoir |
Utilization factor of the reservoir [p.u.] |
File oT_Result_ReservoirSpillage.csv
Identifier |
Header |
Description |
||
|---|---|---|---|---|
Period |
Scenario |
Load level |
Reservoir |
Spilled water in reservoir [hm3] |
File oT_Result_TechnologyReservoirSpillage.csv
Identifier |
Header |
Description |
||
|---|---|---|---|---|
Period |
Scenario |
Load level |
Reservoir |
Spilled water in reservoir by technology [hm3] |
File oT_Result_MarginalWaterValue.csv
Identifier |
Header |
Description |
||
|---|---|---|---|---|
Period |
Scenario |
Load level |
Reservoir |
Water volume value [€/dam3] |
The marginal costs (dual variables) are obtained after fixing the binary investment and operation decisions to their optimal values.
Electricity balance
File oT_Result_BalanceEnergy.csv
Identifier |
Header |
Description |
||
|---|---|---|---|---|
Period |
Scenario |
Load level |
Technology |
Generation, consumption, flows, losses, and demand [GWh] (to be used as a pivot table) |
File oT_Result_BalanceEnergyPerArea.csv
Identifier |
Header |
Description |
||
|---|---|---|---|---|
Period |
Scenario |
Technology |
Area |
Generation, consumption, flows, losses, and demand [GWh] |
Positive values represent generation, and negative values represent demand or consumption. The sum of the values per area (column) must be 0. EnergyFlowIn and EnergyFlowOut are the sum of the incoming and outgoing flows of the corresponding area nodes. These values represent the import/export of energy to/from other areas only if the network is radial (like an antenna).
File oT_Result_BalanceEnergyPerNode.csv
Identifier |
Header |
Description |
|||
|---|---|---|---|---|---|
Period |
Scenario |
Load level |
Technology |
Node |
Generation, consumption, flows, losses, and demand [GWh] |
File oT_Result_BalanceEnergyPerTech.csv
Identifier |
Header |
Description |
||||
|---|---|---|---|---|---|---|
Period |
Scenario |
Load level |
Area |
Node |
Technology |
Generation, consumption, flows, losses, and demand [GWh] |
Electricity network operation
File oT_Result_NetworkCommitment.csv
Identifier |
Header |
Description |
||||
|---|---|---|---|---|---|---|
Period |
Scenario |
Load level |
Initial node |
Final node |
Circuit |
Line commitment decision [p.u.] |
File oT_Result_NetworkSwitchOn.csv
Identifier |
Header |
Description |
||||
|---|---|---|---|---|---|---|
Period |
Scenario |
Load level |
Initial node |
Final node |
Circuit |
Line switch on decision [p.u.] |
File oT_Result_NetworkSwitchOff.csv
Identifier |
Header |
Description |
||||
|---|---|---|---|---|---|---|
Period |
Scenario |
Load level |
Initial node |
Final node |
Circuit |
Line switch off decision [p.u.] |
File oT_Result_NetworkFlowElecPerNode.csv
Identifier |
Header |
Description |
||||
|---|---|---|---|---|---|---|
Period |
Scenario |
Load level |
Initial node |
Final node |
Circuit |
Electric line flow [MW] |
File oT_Result_NetworkEnergyElecPerArea.csv
Identifier |
Header |
Description |
|||
|---|---|---|---|---|---|
Period |
Scenario |
Load level |
Initial area |
Final area |
Area flow energy [GWh] |
File oT_Result_NetworkEnergyElecTotalPerArea.csv
Identifier |
Header |
Description |
||
|---|---|---|---|---|
Period |
Scenario |
Initial area |
Final area |
Area flow energy [GWh] |
File oT_Result_NetworkEnergyElecTransport.csv
Identifier |
Header |
Description |
||||
|---|---|---|---|---|---|---|
Period |
Scenario |
Load level |
Initial node |
Final node |
Circuit |
Energy transported [GWh-Mkm] |
File oT_Result_NetworkElecUtilization.csv
Identifier |
Header |
Description |
||||
|---|---|---|---|---|---|---|
Period |
Scenario |
Load level |
Initial node |
Final node |
Circuit |
Line utilization (i.e., ratio between flow and capacity) [p.u.] |
File oT_Result_NetworkLosses.csv
Identifier |
Header |
Description |
||||
|---|---|---|---|---|---|---|
Period |
Scenario |
Load level |
Initial node |
Final node |
Circuit |
Line losses [MW] |
File oT_Result_NetworkAngle.csv
Identifier |
Header |
Description |
||
|---|---|---|---|---|
Period |
Scenario |
Load level |
Node |
Voltage angle [rad] |
File oT_Result_NetworkPNS.csv
Identifier |
Header |
Description |
||
|---|---|---|---|---|
Period |
Scenario |
Load level |
Node |
Power not served by node [MW] |
File oT_Result_NetworkENS.csv
Identifier |
Header |
Description |
||
|---|---|---|---|---|
Period |
Scenario |
Load level |
Node |
Energy not served by node [GWh] |
File oT_Result_SummaryNetwork.csv
Identifier |
Header |
Description |
||
|---|---|---|---|---|
Period |
Scenario |
Load level |
Node |
Network output (to be used as a pivot table) |
Hydrogen balance and network operation
File oT_Result_BalanceHydrogen.csv
Identifier |
Header |
Description |
||
|---|---|---|---|---|
Period |
Scenario |
Load level |
Technology |
Generation, flows, and demand [tH2] |
File oT_Result_BalanceHydrogenPerArea.csv
Identifier |
Header |
Description |
|||
|---|---|---|---|---|---|
Period |
Scenario |
Load level |
Technology |
Area |
Generation, flows, and demand [tH2] |
File oT_Result_BalanceHydrogenPerNode.csv
Identifier |
Header |
Description |
|||
|---|---|---|---|---|---|
Period |
Scenario |
Load level |
Technology |
Node |
Generation, flows, and demand [tH2] |
File oT_Result_BalanceHydrogenPerTech.csv
Identifier |
Header |
Description |
||||
|---|---|---|---|---|---|---|
Period |
Scenario |
Load level |
Area |
Node |
Technology |
Generation, flows, and demand [tH2] |
File oT_Result_NetworkFlowH2PerNode.csv
Identifier |
Header |
Description |
||||
|---|---|---|---|---|---|---|
Period |
Scenario |
Load level |
Initial node |
Final node |
Circuit |
Hydrogen pipeline flow [tH2] |
File oT_Result_NetworkH2Utilization.csv
Identifier |
Header |
Description |
||||
|---|---|---|---|---|---|---|
Period |
Scenario |
Load level |
Initial node |
Final node |
Circuit |
Hydrogen pipeline utilization (i.e., ratio between flow and capacity) [p.u.] |
File oT_Result_NetworkHNS.csv
Identifier |
Header |
Description |
||
|---|---|---|---|---|
Period |
Scenario |
Load level |
Node |
Hydrogen not served by node [tH2] |
Heat generation operation
File oT_Result_GenerationHeat.csv
Identifier |
Header |
Description |
||
|---|---|---|---|---|
Period |
Scenario |
Load level |
Generator |
Output (discharge in ESS) [MW] |
File oT_Result_GenerationSurplusHeat.csv
Identifier |
Header |
Description |
||
|---|---|---|---|---|
Period |
Scenario |
Load level |
Generator |
Power surplus [MW] |
File oT_Result_GenerationEnergyHeat.csv
Identifier |
Header |
Description |
||
|---|---|---|---|---|
Period |
Scenario |
Load level |
Generator |
Energy (discharge in ESS) [GWh] |
File oT_Result_TechnologyGenerationHeat.csv
Identifier |
Header |
Description |
||
|---|---|---|---|---|
Period |
Scenario |
Load level |
Technology |
Output (discharge in ESS) [MW] |
File oT_Result_TechnologyGenerationEnergyHeat.csv
Identifier |
Header |
Description |
||
|---|---|---|---|---|
Period |
Scenario |
Load level |
Technology |
Energy (discharge in ESS) [GWh] |
File oT_Result_TechnologyGenerationEnergyHeat_AreaName.csv
Identifier |
Header |
Description |
||
|---|---|---|---|---|
Period |
Scenario |
Load level |
Technology |
Energy (discharge in ESS) per area [GWh] |
Heat balance and network operation
File oT_Result_BalanceHeat.csv
Identifier |
Header |
Description |
||
|---|---|---|---|---|
Period |
Scenario |
Load level |
Technology |
Generation, flows, and demand [GWh] |
File oT_Result_BalanceHeatPerArea.csv
Identifier |
Header |
Description |
|||
|---|---|---|---|---|---|
Period |
Scenario |
Load level |
Technology |
Area |
Generation, flows, and demand [GWh] |
File oT_Result_BalanceHeatPerNode.csv
Identifier |
Header |
Description |
|||
|---|---|---|---|---|---|
Period |
Scenario |
Load level |
Technology |
Node |
Generation, flows, and demand [GWh] |
File oT_Result_BalanceHeatPerTech.csv
Identifier |
Header |
Description |
||||
|---|---|---|---|---|---|---|
Period |
Scenario |
Load level |
Area |
Node |
Technology |
Generation, flows, and demand [GWh] |
File oT_Result_NetworkEnergyHeatPerArea.csv
Identifier |
Header |
Description |
|||
|---|---|---|---|---|---|
Period |
Scenario |
Load level |
Initial area |
Final area |
Area flow energy [GWh] |
File oT_Result_NetworkEnergyHeatTotalPerArea.csv
Identifier |
Header |
Description |
||
|---|---|---|---|---|
Period |
Scenario |
Initial area |
Final area |
Area flow energy [GWh] |
File oT_Result_NetworkEnergyHeatTransport.csv
Identifier |
Header |
Description |
||||
|---|---|---|---|---|---|---|
Period |
Scenario |
Load level |
Initial node |
Final node |
Circuit |
Energy transported [GWh-Mkm] |
File oT_Result_NetworkHeatUtilization.csv
Identifier |
Header |
Description |
||||
|---|---|---|---|---|---|---|
Period |
Scenario |
Load level |
Initial node |
Final node |
Circuit |
Pipeline utilization (i.e., ratio between flow and capacity) [p.u.] |
File oT_Result_NetworkHeatNS.csv
Identifier |
Header |
Description |
||
|---|---|---|---|---|
Period |
Scenario |
Load level |
Node |
Heat not served by node [MW] |
File oT_Result_NetworkFlowHeatPerNode.csv
Identifier |
Header |
Description |
||||
|---|---|---|---|---|---|---|
Period |
Scenario |
Load level |
Initial node |
Final node |
Circuit |
Heat pipe flow [MW] |
File oT_Result_NetworkHTNS.csv
Identifier |
Header |
Description |
||
|---|---|---|---|---|
Period |
Scenario |
Load level |
Node |
Heat not served by node [MW] |
Costs and revenues
File oT_Result_CostSummary.csv
Identifier |
Header |
Description |
|
|---|---|---|---|
Period |
Cost type |
MEUR |
Cumulative cost considering the period weight |
… |
… |
MEUR/year |
Yearly cost |
File oT_Result_CostSummary_AreaName.csv
Identifier |
Header |
Description |
||
|---|---|---|---|---|
Period |
Scenario |
Cost type |
MEUR |
Cumulative cost considering the period weight |
… |
… |
… |
MEUR/year |
Yearly cost |
File oT_Result_CostRecovery.csv
Identifier |
Description |
|---|---|
Cost/revenue type |
Revenues and investment costs [M€] |
File oT_Result_SummaryKPIs.csv
Identifier |
Description |
|---|---|
KPI |
Several KPIs |
File oT_Result_TechnologyLCOE.csv
Identifier |
Description |
|---|---|
Technology |
Levelized Cost of Electricity (LCOE) [€/MWh] |
File oT_Result_TechnologyLCOH.csv
Identifier |
Description |
|---|---|
Technology |
Levelized Cost of Heating (LCOH) [€/MWh] |
File oT_Result_GenerationCostOandM.csv
Identifier |
Header |
Description |
||
|---|---|---|---|---|
Period |
Scenario |
Load level |
Generator |
O&M cost for the generation [M€] |
File oT_Result_GenerationCostOperation.csv
Identifier |
Header |
Description |
||
|---|---|---|---|---|
Period |
Scenario |
Load level |
Generator |
Operation cost for the generation [M€] |
File oT_Result_ConsumptionCostOperation.csv
Identifier |
Header |
Description |
||
|---|---|---|---|---|
Period |
Scenario |
Load level |
Pump |
Operation cost for the consumption [M€] |
File oT_Result_GenerationCostOperatingReserve.csv
Identifier |
Header |
Description |
||
|---|---|---|---|---|
Period |
Scenario |
Load level |
Generator |
Operating reserve cost for the generation [M€] |
File oT_Result_ConsumptionCostOperatingReserve.csv
Identifier |
Header |
Description |
||
|---|---|---|---|---|
Period |
Scenario |
Load level |
Pump |
Operating reserve cost for the consumption [M€] |
File oT_Result_GenerationCostEmission.csv
Identifier |
Header |
Description |
||
|---|---|---|---|---|
Period |
Scenario |
Load level |
Generator |
Emission cost for the generation [M€] |
File oT_Result_NetworkCostENS.csv
Identifier |
Header |
Description |
||
|---|---|---|---|---|
Period |
Scenario |
Load level |
Node |
Reliability cost (cost of the ENS and HNS) [M€] |
File oT_Result_RevenueEnergyGeneration.csv
Identifier |
Header |
Description |
||
|---|---|---|---|---|
Period |
Scenario |
Load level |
Generator |
Operation revenues for the generation [M€] |
File oT_Result_RevenueEnergyConsumption.csv
Identifier |
Header |
Description |
||
|---|---|---|---|---|
Period |
Scenario |
Load level |
ESS Generator |
Operation revenues for the consumption/charge [M€] |
File oT_Result_RevenueGenOperatingReserveUp.csv
Identifier |
Header |
Description |
||
|---|---|---|---|---|
Period |
Scenario |
Load level |
Generator |
Operation revenues from the upward operating reserve [M€] |
File oT_Result_RevenueConOperatingReserveUp.csv
Identifier |
Header |
Description |
||
|---|---|---|---|---|
Period |
Scenario |
Load level |
ESS Generator |
Operation revenues from the upward operating reserve [M€] |
File oT_Result_RevenueOperatingReserveDown.csv
Identifier |
Header |
Description |
||
|---|---|---|---|---|
Period |
Scenario |
Load level |
Generator |
Operation revenues from the downward operating reserve [M€] |
File oT_Result_RevenueOperatingReserveDownESS.csv
Identifier |
Header |
Description |
||
|---|---|---|---|---|
Period |
Scenario |
Load level |
ESS Generator |
Operation revenues from the downward operating reserve [M€] |
File oT_Result_RevenueRampReserveUp.csv
Identifier |
Header |
Description |
||
|---|---|---|---|---|
Period |
Scenario |
Load level |
Generator |
Operation revenues from the upward ramp reserve [M€] |
File oT_Result_RevenueRampReserveDw.csv
Identifier |
Header |
Description |
||
|---|---|---|---|---|
Period |
Scenario |
Load level |
Generator |
Operation revenues from the downward ramp reserve [M€] |
File oT_Result_GenerationCapturedSRMC.csv
Identifier |
Header |
Description |
||
|---|---|---|---|---|
Period |
Scenario |
Load level |
Generator |
Captured SRMC when generating [€/MWh] |
SRMC is the short-run marginal cost. It is computed for each load level as the generator output multiplied by the SRMC, divided by the mean output of each stage.
File oT_Result_ConsumptionCapturedSRMC.csv
Identifier |
Header |
Description |
||
|---|---|---|---|---|
Period |
Scenario |
Load level |
Generator |
Captured SRMC when pumping/charging [€/MWh] |
SRMC is the short-run marginal cost. It is computed for each load level as the ESS consumption multiplied by the SRMC, divided by the mean consumption of each stage.
Marginal information
The marginal costs (dual variables) are obtained after fixing the binary investment and operation decisions to their optimal values.
File oT_Result_MarginalReserveMargin.csv
Identifier |
Header |
Description |
|
|---|---|---|---|
Period |
Scenario |
Area |
Marginal of the minimum adequacy electricity system reserve margin [€/MW] |
File oT_Result_MarginalReserveMarginHeat.csv
Identifier |
Header |
Description |
|
|---|---|---|---|
Period |
Scenario |
Area |
Marginal of the minimum adequacy heat system reserve margin [€/MW] |
File oT_Result_MarginalEmission.csv
Identifier |
Header |
Description |
|
|---|---|---|---|
Period |
Scenario |
Area |
Marginal of the maximum CO2 emission [€/tCO2] |
File oT_Result_MarginalRESEnergy.csv
Identifier |
Header |
Description |
|
|---|---|---|---|
Period |
Scenario |
Area |
Marginal of the minimum RES energy [€/MWh] |
File oT_Result_MarginalIncrementalVariableCost.csv
Identifier |
Header |
Description |
|||
|---|---|---|---|---|---|
Period |
Scenario |
Load level |
Area |
Generator |
Variable cost (fuel+O&M+emission) of the generators with power surplus, except the ESS [€/MWh] |
File oT_Result_MarginalIncrementalGenerator.csv
Identifier |
Description |
|||
|---|---|---|---|---|
Period |
Scenario |
Load level |
Area |
Generator with power surplus, except the ESS, and with the lowest variable cost (fuel+O&M+emission) |
File oT_Result_NetworkSRMC.csv
Identifier |
Header |
Description |
||
|---|---|---|---|---|
Period |
Scenario |
Load level |
Node |
Locational Short-Run Marginal Cost of electricity [€/MWh], a.k.a. Locational Marginal Price (LMP) |
These short-run marginal costs (SRMC) are obtained after fixing the binary and continuous investment decisions and the binary operation decisions to their optimal values. Remember that binary decisions are not affected by marginal changes.
File oT_Result_NetworkSRMCH2.csv
Identifier |
Header |
Description |
||
|---|---|---|---|---|
Period |
Scenario |
Load level |
Node |
Locational Short-Run Marginal Cost of H2 [€/kgH2] |
These short-run marginal costs (SRMC) are obtained after fixing the binary and continuous investment decisions and the binary operation decisions to their optimal values. Remember that binary decisions are not affected by marginal changes.
File oT_Result_NetworkSRMCHeat.csv
Identifier |
Header |
Description |
||
|---|---|---|---|---|
Period |
Scenario |
Load level |
Node |
Locational Short-Run Marginal Cost of heat [€/MWh] |
These short-run marginal costs (SRMC) are obtained after fixing the binary and continuous investment decisions and the binary operation decisions to their optimal values. Remember that binary decisions are not affected by marginal changes.
File oT_Result_MarginalEnergyValue.csv
Identifier |
Header |
Description |
||
|---|---|---|---|---|
Period |
Scenario |
Load level |
Generator |
Energy inflow value [€/MWh] |
File oT_Result_MarginalOperatingReserveUp.csv
Identifier |
Header |
Description |
||
|---|---|---|---|---|
Period |
Scenario |
Load level |
Area |
Marginal of the upward operating reserve [€/MW] |
File oT_Result_MarginalOperatingReserveDown.csv
Identifier |
Header |
Description |
||
|---|---|---|---|---|
Period |
Scenario |
Load level |
Area |
Marginal of the downward operating reserve [€/MW] |
Operational flexibility
File oT_Result_FlexibilityDemand.csv
Identifier |
Header |
Description |
||
|---|---|---|---|---|
Period |
Scenario |
Load level |
Area |
Demand per area variation w.r.t. its mean value [MW] |
File oT_Result_FlexibilityPNS.csv
Identifier |
Header |
Description |
||
|---|---|---|---|---|
Period |
Scenario |
Load level |
Area |
Power not served per area variation w.r.t. its mean value [MW] |
File oT_Result_FlexibilityNetwork.csv
Identifier |
Header |
Description |
||
|---|---|---|---|---|
Period |
Scenario |
Load level |
Area |
Exporting flow from each area to other areas variation w.r.t. its mean value [MW] |
File oT_Result_FlexibilityTechnology.csv
Identifier |
Header |
Description |
||
|---|---|---|---|---|
Period |
Scenario |
Load level |
Technology |
Technology variation w.r.t. its mean value [MW] |
File oT_Result_FlexibilityTechnologyESS.csv
Identifier |
Header |
Description |
||
|---|---|---|---|---|
Period |
Scenario |
Load level |
Technology |
ESS Technology variation w.r.t. its mean value [MW] |